Long-term trends in blood sugar control predict diabetes complications
Type 2 diabetes is an insidious disease because its most damaging effects don't show up for years. A patient may have her ups and downs from day to day, but the risk of heart disease, kidney disease, damage to the retinas and other circulatory problems builds over years with the accumulated stress of high blood sugar levels.
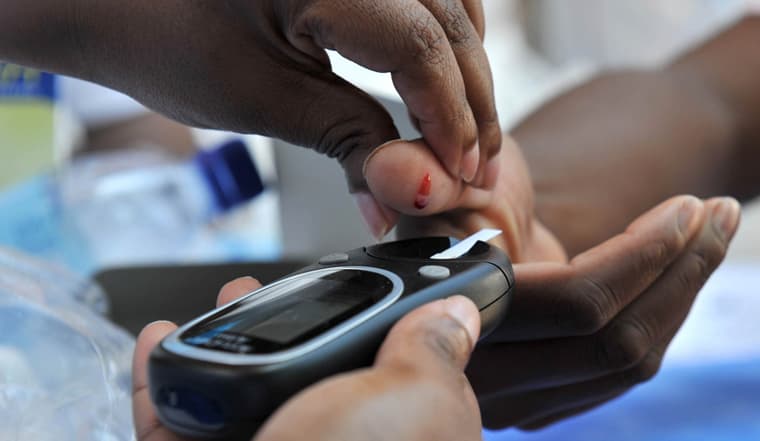
The hemoglobin A1C test is the most common measure of how well a diabetic is controlling her blood sugar levels. It measures the percentage of red blood cells that have extra sugar molecules attached to them over a three-month period, because the body doesn't produce enough insulin to process them. The target A1C for most diabetics is seven percent-a reading much higher than that means that the patient's blood sugar levels have been too high lately, and can suggest the need for adjustments to medication, diet or exercise.
But any one A1C reading is just a snapshot, and doesn't necessarily reflect the patient's risk for complications down the road. Long-term trends matter-and new research from the University of Chicago shows that the trajectory of a patient's A1C level over 10 years can predict their risk of vascular complications and mortality.
Neda Laiteerapong, MD, and her colleagues from the Department of Medicine looked at the health records of more than 28,000 patients with type 2 diabetes from the Kaiser Permanente health system in northern California. They categorized the patient's A1C levels by the patterns they formed when plotted on a graph over 10 years from diagnosis. They found five distinct trajectories: "low stable," meaning they stayed around the recommended seven percent the whole time, "moderate increasing late," "high decreasing early," "moderate peaking late" and "moderate peaking early."
All of the non-stable trajectories were associated with higher risk for microvascular complications such as kidney disease, diabetic retinopathy and lower limb amputation. The "high decreasing early" trajectory was also associated with increased mortality. The results of the study were published earlier this summer in the Journal of Diabetes and its Complications.
Laiteerapong said that this kind of data has always been available to doctors, but it was buried in paper medical charts that made it difficult to spot long-term trends.
"You're looking at the blood test next to the urine text next to the sleep study, all this extra stuff until you find the A1C test," she said. "So you don't see that pattern you can now see in modern electronic medical records, where you click a button that says 'graph' and you can look at it right away."
The good news is that of those 28,000 patients, 80 percent fell into the "low stable" category, meaning the vast majority of them were doing a good job managing their blood sugar consistently, over many years. For the other less stable groups, doctors can take advantage of more sophisticated electronic data sources to spot more troubling long-term trends and adjust their care.
A high A1C reading could be a one-time blip, or it could be part of a longer, upward trajectory that needs to be addressed by adjusting medications. Year-over-year patterns could also help spot seasonal fluctuations that prompt patients to change their diet and exercise routines at certain times of the year (think holiday seasons).
"It gives doctors a long perspective that's important for chronic disease. Don't just focus on today, think of this as part of a person's life history, their medical history," Laiteerapong said.

Matt Wood
Matt Wood is a senior science writer at UChicago Medicine and the Biological Sciences Division.